
Social Security and Poverty
Fixing Social Security, Part 6


Post 63: 19 May 20261
Social Security is America’s best anti-poverty program. This was the program’s initial mission. Its developers wrote that their proposed “old-age annuities are designed to prevent destitution and dependency”—to keep people off “the dole” and to relieve families of some of the burden of eldercare.2 Similarly, in his signing message, FDR said that the retirement provisions were intended to provide “protection to the average citizen…against poverty-ridden old age.”
Social Security does a good job at this. One recent study estimated that 23.5 million Americans would be below the poverty line without the program, including one-in-four seniors. Despite this success, however, about 10% of all seniors still live in poverty. Poverty rates are especially high for single seniors, 18.1%, and especially for single women, 18.6%.3 The renewal of Social Security ought to have, as one of its goals, eradicating this pocket of poverty. It is not the only tool we have to effect this purpose, but it is the main one.
How Benefits are Tied to Work
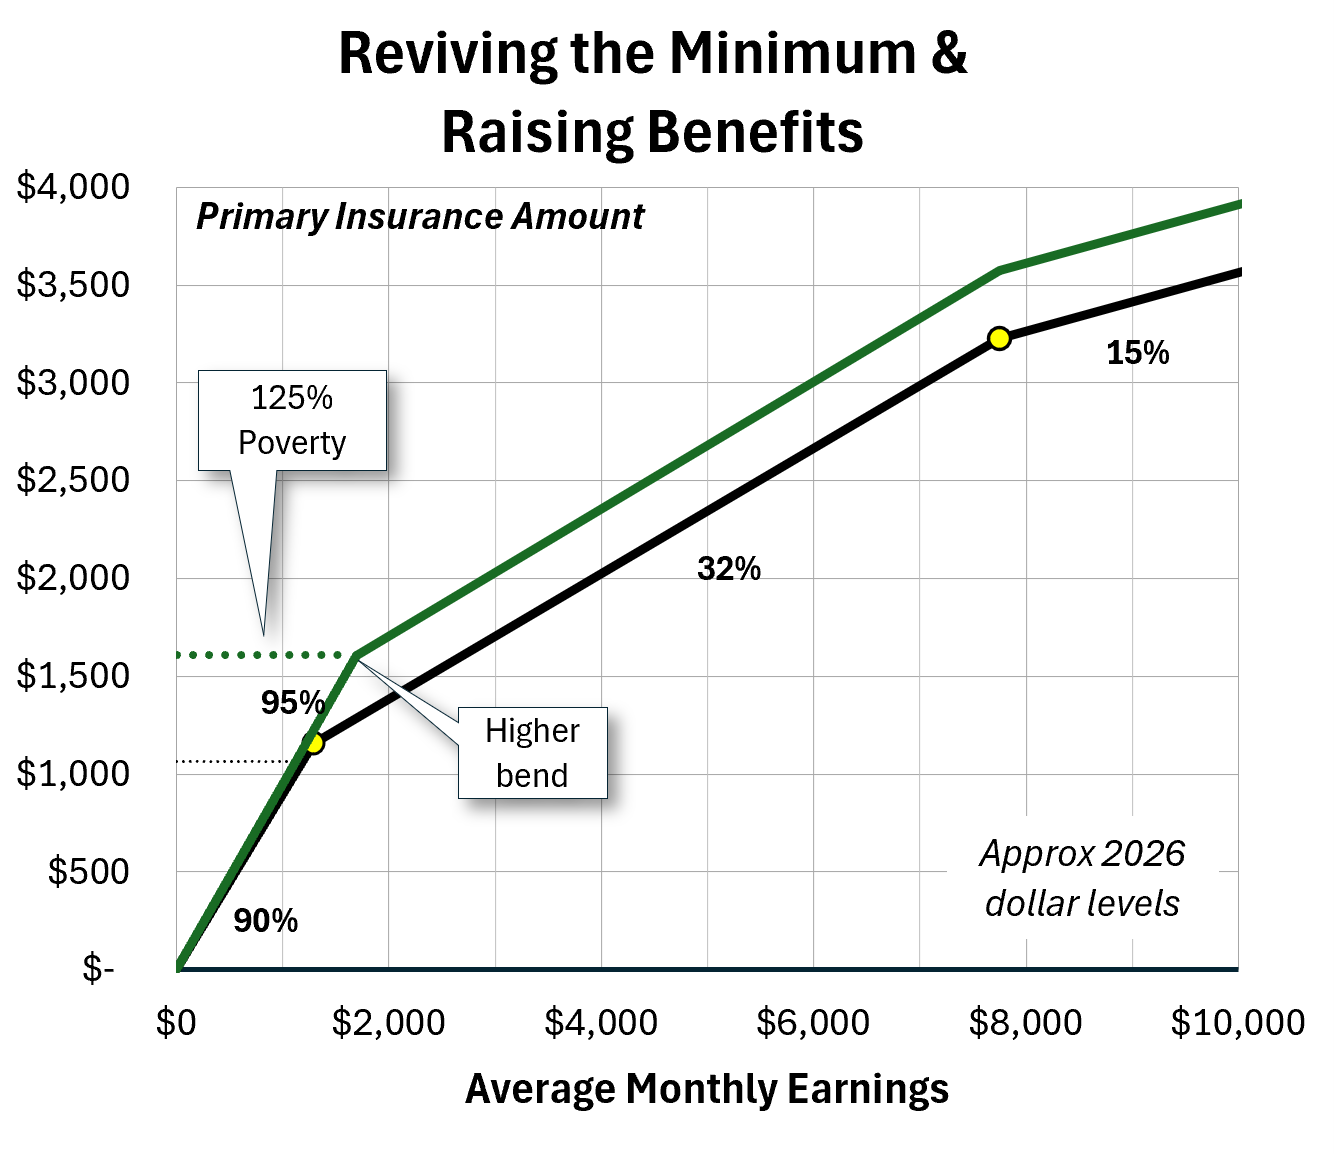
The structure of the Social Security retirement program sets real limits on how well it can fight poverty. The problem is that benefits are tied too tightly to work history. People’s benefits are based on their lifetime earnings as summarized in a construct called “average indexed monthly earnings” or AIME—I’ll just call this “earnings”.4 Earnings map to benefits in a progressive way, rising almost dollar-for-dollar (90¢) up to an initial “bend point” ($1,174 in 2024). Above this level, benefits rise by 32¢ on the dollar up to a second point ($5,904 in 2024). Finally, earnings above this second bend translate to additional benefits only at a rate of 15¢ per dollar.5 This calculation defines what Social Security calls the “primary insurance amount” or PIA. Think of that as a baseline—it’s what we will focus on. If someone retires early, they receive less than this amount and if they wait to retire, they receive more.6
The sketch below plots this benefits schedule with the 90%, 32%, and 15% “wage replacement” rates and the 2024 bend points. This gives an intuitive sense of how benefits rise with wages. Note that the lower bend point corresponds to a PIA very close to the monthly income implied by the federal minimum wage and the (nearly identical) poverty threshold for a single senior. I indicate this level with a horizontal line. For good measure, I add horizontal lines that correspond to the monthly incomes implied by hourly wages of $15 and $20 per hour.

This basic structure was established in the 1977 Social Security Amendments, part of the transition to a system that updates automatically—a good thing. The replacement rates (referred to as “factors”) have not changed since but the bend points are updated to match the overall growth of wages.7 The parameters did not seem to have any empirical or theoretical basis but were instead chosen for continuity. We should not feel that wedded to any of them.
The “Special Minimum”
As a poverty-fighting tool, the main shortcoming of this schedule is obvious: low-wage earners are entitled to very low benefits. So long as we conceptualize the benefit curve only as a “replacement” for wages, there will be a hard limit on the degree to which the program can reduce senior poverty. This limitation was always apparent, which is why the original program included a “special minimum” benefit for workers who earned low wages over their whole lifetimes. I am not sure if the special minimum was ever sufficient, but as its levels were updated over time for inflation it became defunct. As far as I know, new retirees never qualify for it now. The concept is still on the books and part of the machinery of the program, however; we can still use it to tackle the poverty problem.
If any new retiree did qualify for it, the special minimum would now be worth $1067 per month. Since no one does, plenty of new retirees have baseline entitlements (PIAs) less than that. In 2024, about 10% of new retirees were at the left end of this curve, with PIAs of $1000 or less. This isn’t an exact overlap with the set of seniors living in poverty (also about 10%), but the connection is clear enough.8
The special minimum makes a small conceptual break with the notion that Social Security benefits “replace” but can never exceed wages, but it is still closely tied to work effort. To earn the full special minimum, a claimant would need to have a certain minimum level of earnings for 30 years. Fewer years of work (“years of coverage” or YOC in the parlance) earn prorated minimums, with everyone needing at least 11 valid years to earn anything. One reason the special minimum is defunct is that these YOC thresholds are too high, above the poverty threshold and above what a minimum wage worker would expect to earn. The main Social Security program itself requires only 10 valid quarters to trigger some sort of benefit, and the current earnings threshold is only $7,560 per year. Reviving the special minimum will require redefining a YOC in a more realistic way. Progressive reform proposals like the one led by Bernie Sanders (more below) simply adopt the much lower standard for general Social Security eligibility. This is a good start.9
Progressive Proposals
The main progressive proposal, spearheaded by Bernie Sanders, reinvigorates the special minimum and adjusts the first bend point upward. The first change sets the minimum benefit at 125% of poverty (indexed to wage growth in the future) for anyone who worked for thirty years (see below). Raising this bend point raises everyone’s benefits (by perhaps $200), which raises costs by about 1.6% of payroll in the long run. Raising the minimum benefit is much more affordable, with a long-term effect equivalent to a 0.15% increase in the payroll tax. The sketch below gives a general sense of these changes.10
The Sanders proposal does a lot, but it does not respond to the concerns I have raised in these pages about early retirement pressures and the need to protect the incomes of long-time retirees. It also does not fully respond to the general problem that benefit levels are too strongly tied work experience and lifetime earnings. I’ll close today with a few thoughts about that.
Old Age Security and the Work Incentive
One thing that most seniors who earn low Social Security benefits, or who have low incomes generally, have in common is a low lifetime engagement in the labor force. This has a big effect on the average monthly earnings calculation (the AIME) that formed the horizontal axis in the benefits graph above.
Your AIME is based on your 35 highest-earning years of work history. Here’s the rub: if you have fewer years of covered work history than that, the missing years are recorded, and averaged in, as zeros. This has a huge impact. Retirees at the lower end of the average wage axis are very likely to be there because they have a lot of those zero years. Among those in the lowest quartile of lifetime earnings, only 23% have 30 or more years of wage data in their record. Among the other three-quarters of workers, 93% do. One-in-eight of these workers has fewer than ten years of work history. Folks in this last category often fail to qualify for Social Security at all and, of those who do, most receive benefits as a spouse or survivor, not as retired workers. This puts single people at especially high risk.11
Some “reforms” aimed at saving the Trust Fund cash propose raising the 35-year average to a 38- or 40-year one. A 40-year rule would save the equivalent of 0.5% on the payroll tax, which alone would fund 14% of the long-term shortfall.12 This change, if we were to make it, would have very little impact on high earning individuals but cut benefits for lower-earning ones by an average of more than 4%.13
That is exactly the wrong way to go. We ought to be lowering the number of years used for these computations, at least for some targeted groups. We have to understand who these people are. A recent Congressional Research Service (CRS) study (I cited it above) examined the characteristics of workers with the lowest lifetime earnings. Women comprise three-quarters of this group. And nearly half have three or more children, compared to 30% of other workers. They are also much more likely to report health issues, with 27% reporting a work-disrupting disability at age 62, compared to only 10% of other workers. I would love to know more, but this study, though excellent, is a bit of a fly-over.14
We can take meaningful action is to reduce the penalty that people—usually women—pay for caregiving. Childbearing costs women (again, usually) time on the job and tends to lower earnings generally.15 Several proposals have been made to allow individuals to exempt “childcare years” from the AIME computation. Allowing five “dropout” years for caring for young children would not cost much, the equivalent of raising the payroll tax by 0.24%, and would only make the Trust Fund deficit slightly worse.16 This is not part of the progressive package, but should be. We should also make allowances for others engaged in caregiving. Prospectively, that would not be difficult to do.
When the “special minimum” fails to protect people from poverty, the final backstop in the system is the SSI program, but it is extremely stingy and difficult to qualify for. To receive SSI, individuals must have very low incomes and virtually no assets. Even among the poorest seniors, less than one-in-three qualify and, on average, receive an average of only $560 per month from the program.17 Like the special minimum, the role SSI plays has declined over the years, mainly due to how the program is indexed to inflation. While it is essential to the few who receive it, it is not, and probably never was, a serious response to poverty.
Concluding Thoughts
Social Security benefits are excessively linked to work history and labor-market earnings. Some of the issue relates directly to work time lost due to childcare and other family caregiving. By accounting for those cases, we can significantly improve the program without making the fiscal imbalance much worse. A more difficult problem is that low work “effort” is often associated with health and disability issues. There is a disability system in place and, on paper, it seems adequate, but close study suggests that many “low earners” who then receive low Social Security benefits fall between the cracks of the DI system—they are unhealthy enough to have their conditions affect work, but are not unhealthy enough to qualify for disability insurance. (Or, let’s be honest, are not able to navigate that difficult bureaucratic system.) The whole concept of “early retirement” is infected with this problem; see the discussion in “When Should People Retire?”
The American welfare state is heavily tied to work—I have noted and complained about this before. The vague but pernicious logic of this rests on an assumption that, left to their own devices, poor people will provide only the minimum possible work effort; that is, they are lazy. Handouts induce idleness. The assumption is a thin veil for class- and race-based prejudices, but it is also mostly incorrect.18 It makes the least sense when we are talking about retirement benefits. Do we really think people will not work when they are in their 20s and 30s because they know they will have benefits coming in their 60s and 70s? Or that the promise of a slightly bigger Social Security check at age 70 will spur work ambitions at 30? That is just ridiculous, especially since people now in their 30s are more apt to believe that they will never receive any benefits. The minimum benefit needs to have a much lower lifetime work qualification.
That’s all for today.
I had expected today’s essay to be about how “progressive” Social Security is—what that means or could mean and how we could make it more so—but I ultimately did not think that was the right question, at least not at the moment. I may still write an essay about that at some point in the future.
I plan to conclude this series on Social Security next week. Here’s an overview of these essays:
Part 1: What is Social Security For? [Post 58]
Part 2: America Aging in Place [Post 59]
Part 3: Paying for Retirement [Post 60]
Part 4: When Should We Retire? [Post 61]
Part 5: Fun with COLAs [Post 62]
Part 6: Social Security and Poverty
Part 7: Social Security and Market Risk
<All of the posts in On Social Citizenship connect. I recommend that readers go back and read the first entry in the series.>
Notes
Photo: Frances Perkins, Secretary of Labor and architect of the Social Security Act, with Franklin Roosevelt, 1935. Library of Congress photo. [I cropped Eleanor Roosevelt out (forgive me!).]
Report of the Committee on Economic Security, January 15, 1935. I characterize the mission in broader social citizenship terms.
Kathleen Romig, “Social Security Lifts More People Above the Poverty Line Than Any Other Program”, Center on Budget and Policy Priorities, February 25, 2026.
See the SSA explanation. The AIME is based on the highest 35 years of wage income (see below). Wages for each year are normalized based on the national wage bill and averaged to get a monthly figure. The reference year for everyone is the year in which they turn 62.
An effective, not formal, “maximum” benefit results because taxable wages are capped. Proposals to uncap covered wages would/should uncap benefits as well; we have to deal with that.
The late/early carrots and sticks are important, but outside the scope today.
In 2024 the poverty threshold for single seniors was $15,050 per year, or $1,254 per month. The minimum wage ($7.25/hour) maps to a monthly income of $1,257 by assuming 40 hour weeks and averaging (52 weeks/12 months). The same technique was used for the other wage levels: $15/hour maps to $2,600 per month and $20 to $3,467.
See the discussion of COLAs last week. What I did not say last week—but should have—was that this split was intentional in 1977; it was called “decoupling”. Its purpose was to prevent the “wage replacement rate” from rising after the point of the initial claim (what I want). For 2026, the bend points are $1,286 and $7,749.
2025 Statistical Supplement Table 6.B4
A valid year (a “year of coverage” or YOC) requires earnings of about $19,000 today. Official explanations of the special minimum are very opaque, so I could be getting some of this wrong.
There many other progressive proposals. I probably should respond to his package in detail as a stand-alone essay at some point.
Zhe Li, “Lifetime Low Earners and Social Security: Analysis of Data from the Health and Retirement Study (HRS)” (Congressional Research Service, R48897, April 6, 2026). It focused on the1940-1959 cohorts in 2000. Among those with fewer than 10 years covered work experience, 49% were not beneficiaries, 8% received benefits as disabled persons, 41% as spouses or survivors, and only 3% as retired workers. [Fig 8]
See SSA estimates.
See Barry Huston and Zhe Li, “Social Security: Potential Impacts of Changes in Computation Years” (Congressional Research Service, R47330, December 12, 2022).
Li, “Lifetime Low Earners”. The other large group was late-arriving immigrants. I would place that issue in its own category. I assume previously incarcerated people and some with substance abuse or mental health issues are also over-represented, but the data source did not probe for that.
This is a larger topic worth exploring. See Patricia Cortés and Jessica Pan, “Children and the Remaining Gender Gaps in the Labor Market”, NBER Working Paper No. 27980, October 2020. They conclude that “close to two-thirds of the overall gender earnings gap can be accounted for by the differential impacts of children on women and men”.
Proposed by the National Academy of Social Insurance in 2009 and later by Rep. Murphy 2016. Conservatives could display their pro-family values here. See also: American Academy of Actuaries, “Social Security Reform: Benefit Formula Options”, August 2022; and Alicia Munnell, “Child Care Credits for Social Security” (CRR, BC) April 6, 2016.
See Daniel Thompson and Michael D. King, “Income Sources of Older Households: 2017” (Census Bureau, Current Population Reports, P70BR-177) February 2022. See Zhe Li and Paul Davies, “Income for the Population Ages 65 and Older” (Congressional Research Service, R47341, August 5, 2025). See Social Security Administration, 2025 Annual Statistical Supplement, Table 3.C4. SSI requires that recipients have incomes of less than about $1000 per month and assets of $2000 or less.
Some basic income experiments find that recipients reduce work effort, even to the point where total incomes fall, but does this signal “laziness” or the value of that time off for people who are overworked in the worst jobs our economy has on offer?